Prometheus Operator使用简介
Prometheus Operator简介
Prometheus Operator包含以下CRD资源,分别对应prometheus对应的配置。
Prometheus, 定义实例Prometheus的部署Alertmanager, 定义实例Alertmanager的部署ThanosRuler,定义Thanos Ruler的部署.ServiceMonitor, 基于Service来抓取metrics数据PodMonitor, 基于Pod来抓取metrics数据Probe, which declaratively specifies how groups of ingresses or static targets should be monitored. The Operator automatically generates Prometheus scrape configuration based on the definition.PrometheusRule, Prometheus alerting和recording rules的定义AlertmanagerConfig, Alertmanager configuration的配置信息
ServiceMonitor/PodMonitor
ServiceMonitor和PodMonitor都是定义一组Endpoint的目标抓取,ServiceMonitor根据selector字段来找到对应Service后端的Endpoints来进行数据抓取,Endpoint有可能是Pod ip,也有可能是物理机或虚拟机ip。PodMonitor直接根据selector匹配的pod信息来进行抓取,两个维度不一样,某些场景下两者都可以使用。
配置示例
apiVersion: monitoring.coreos.com/v1
kind: ServiceMonitor
metadata:
  name: go-demo    # 填写一个唯一名称
  namespace: cm-prometheus  # namespace固定,不要修改
spec:
  endpoints:
  - interval: 30s
    # 填写service yaml中Prometheus Exporter对应的Port的Name
    port: 8080-8080-tcp
    # 填写Prometheus Exporter对应的Path的值,不填默认/metrics
    path: /metrics
    relabelings:
    # ** 必须要有一个 label 为 application,这里假设 k8s 有一个 label 为 app,
    # 我们通过 relabel 的 replace 动作把它替换成了 application
    - action: replace
      sourceLabels:  [__meta_kubernetes_pod_label_app]
      targetLabel: application
  # 选择要监控service所在的namespace
  namespaceSelector:
    matchNames:
    - golang-demo
  # 填写要监控service的Label值,以定位目标service
  selector:
    matchLabels:
      app: golang-app-demo
查看是否生效,登录prometheus页面
k -n kubesphere-monitoring-system port-forward prometheus-k8s-0 9090
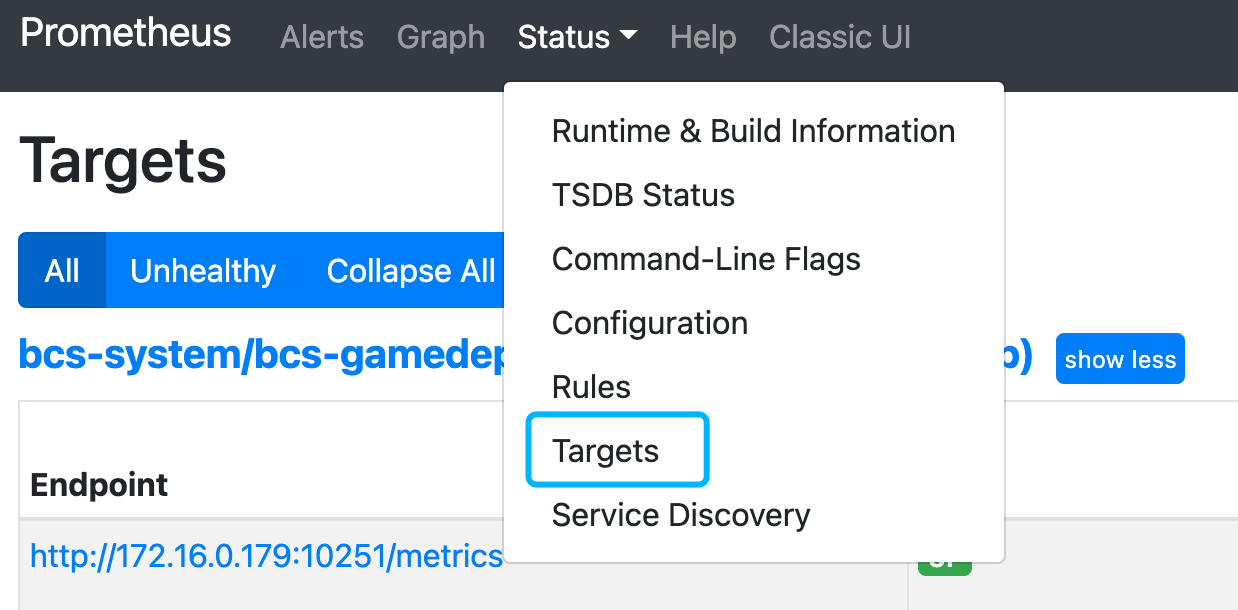
确定Target里有对应的Endpoint,并且为up状态即可。